One of the most commonly used strategies for clinical decision making mirrors the scientific method of hypothesis generation followed by hypothesis testing. Diagnostic hypotheses are accepted or rejected based on testing.
Hypothesis Generation
Hypothesis generation involves the identification of the main diagnostic possibilities (differential diagnosis) that might account for the patient’s clinical problem. The patient’s chief complaint (eg, chest pain) and basic demographic data (age, sex, race) are the starting points for the differential diagnosis, which is usually generated by pattern recognition. Each element on the list of possibilities is ideally assigned an estimated probability, or likelihood, of its being the correct diagnosis (pre-test probability—for an example, see table ).
Clinicians by necessity often use vague terms such as “highly likely,” “improbable,” and “cannot exclude" to describe the likelihood of disease. Both clinicians and patients may misinterpret such semiquantitative terms; hence explicit statistical terminology should be used if and when available. Mathematical computations can assist clinical decision making and, even when exact numbers are unavailable, can better define clinical probabilities. However, specific "numbers" are generated from only a small fraction of total clinical patients and thus are still only estimates.
Probability and odds
The probability of a disease (or event) occurring in a patient whose clinical information is unknown is the frequency with which that disease or event occurs in a population. Probabilities range from 0.0 (impossible) to 1.0 (certain) and are often expressed as percentages (from 0 to 100). A disease that occurs in 2 of 10 patients has a probability of 2/10 (0.2 or 20%). Rounding very small probabilities to 0, thus excluding all possibility of disease (sometimes done in implicit clinical reasoning), can potentially be misleading.
Odds represent the ratio of affected to unaffected patients (ie, the ratio of disease to no disease). Thus, a disease that occurs in 2 of 10 patients (probability of 2/10) has odds of 2/8 (0.25, often expressed as 1 to 4). Odds (Ω) and probabilities (p) can be converted one to the other, as in Ω = p/(1 − p) or p = Ω/(1 + Ω).

Hypothesis Testing
The initial differential diagnosis based on chief complaint and demographics is often large, so the clinician first generates and filters the hypothetical possibilities by obtaining the detailed history and doing a directed physical examination to support or refute suspected diagnoses. For instance, in a patient with chest pain, a history of recent leg pain and a swollen, tender leg detected during examination increases the probability of pulmonary embolism.
When the history and physical examination form a recognizable pattern, a presumptive diagnosis is made. As a first step, patient history is key in forming a diagnostic hypothesis, which leads to a focused physical examination that supports or refutes that hypothesis and helps to establish a more refined pre-test probability of a diagnosis (1).
Diagnostic testing is used when uncertainties persist after the history and physical examination, particularly when the diseases remaining under consideration are serious or have dangerous or costly treatment. Test results further modify the probabilities of different diagnoses (post-test probability). For example, the table shows how the additional findings that the hypothetical patient had leg pain and swelling and a normal ECG and chest radiograph modify diagnostic probabilities—the probability of acute coronary syndrome, dissecting thoracic aortic aneurysm, and pneumothorax decreases, and the probability of pulmonary embolism increases. These changes in probability may lead to additional testing (in this example, probably chest CT angiography) that further modifies post-test probability and, in some cases, confirms or refutes a diagnosis.
It may seem intuitive that the sum of probabilities of all diagnostic possibilities should equal nearly 100% and that a single diagnosis can be derived from a complex array of symptoms and signs. However, applying the principle that the best explanation for a complex situation involves a single cause (often referred to as Occam's razor) can lead clinicians astray. Rigid application of this principle discounts the possibility that a patient may have more than one active disease. For example, a dyspneic patient with known chronic obstructive pulmonary disease (COPD) may be presumed to be having an exacerbation of COPD but may also be suffering from a pulmonary embolism or heart failure.
Hypothetical Differential Diagnosis and Pre-Test and Post-Test Probabilities for Chest Pain in a 50-Year-Old With Hypertension and Diabetes who Smokes Cigarettes
Diagnosis | Pre-Test Probability | Post-Test Probability I (Additional Findings of Leg Pain, Swelling, and Normal ECG and Chest Radiograph) | Post-Test Probability II (Additional Findings of Segmental Defect on Chest CT Angiography and Normal Serum Troponin I Level) |
|---|---|---|---|
Acute coronary syndrome | 40% | 28% | 1% |
ST-segment elevation myocardial infarction | 20% | < 1% | < 1% |
Chest wall pain | 30% | 20% | < 1% |
Pulmonary embolism | 5% | 50% | 98% |
Dissecting thoracic aortic aneurysm | < 3% | < 1% | < 1% |
Spontaneous pneumothorax | < 2% | < 1% | < 1% |
Hypothesis testing reference
1. Garibaldi BT, Olson APJ. The Hypothesis-Driven Physical Examination. Med Clin North Am. 2018;102(3):433-442. doi:10.1016/j.mcna.2017.12.005
Probability Estimations and the Testing Threshold
Even when diagnosis is uncertain, testing is not always necessary. A test should be done only if its results will affect current or future management. When disease pre-test probability is above a certain threshold, treatment is warranted (treatment threshold) and testing may not be indicated.
Below the treatment threshold, testing is indicated when a positive test result would raise the post-test probability above the treatment threshold. The lowest pre-test probability at which this can occur depends on test characteristics and is termed the testing threshold.
In all cases, the need for testing may be significantly impacted by the patient's or clinician's level of comfort with the assumed diagnosis.
Probability Estimations and the Treatment Threshold
The disease probability at and above which treatment is given and no further testing is warranted is termed the treatment threshold (TT).
The above hypothetical example of a patient with chest pain, acutely swollen tender leg, and dyspnea converged on a near-certain diagnosis (98% probability). When diagnosis of a disease is thought to be certain, the decision to treat is a straightforward determination of whether there is a benefit of treatment (compared with no treatment, and taking into account the potential adverse effects of treatment). When the diagnosis has some degree of uncertainty, as is almost always the case, the decision to treat also must balance the benefit of treating a sick person against the risk of erroneously treating a well person or a person with a different disorder; benefit and risk encompass financial, social, and medical consequences. This balance must take into account both the likelihood of disease and the magnitude of the benefit and risk. This balance determines where the clinician sets the treatment threshold. The final decision to treat should include patient preferences whenever they can be ascertained.
Pearls & Pitfalls
|
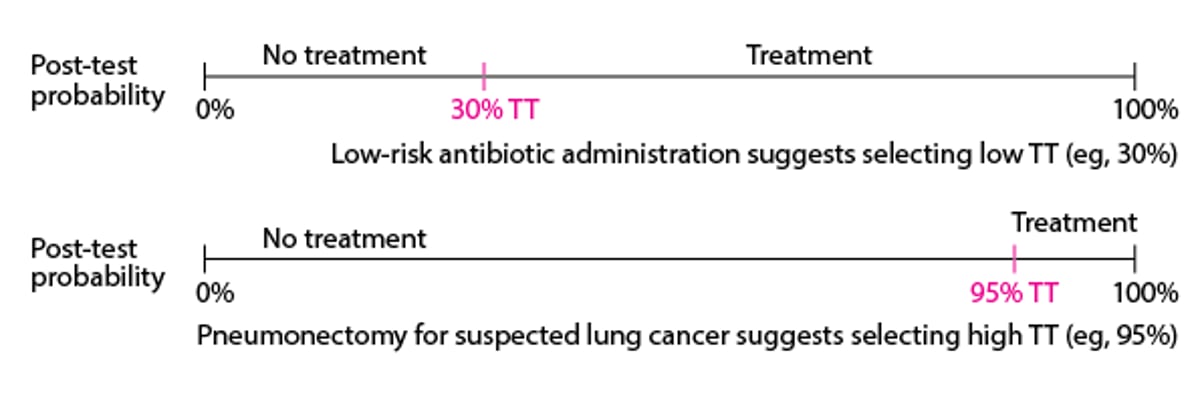
Conceptually, if the benefit of treatment is very high and the risk is very low (as when giving a safe antibiotic to a patient with diabetes who possibly has a life-threatening infection), clinicians tend to accept high diagnostic uncertainty and might initiate treatment even if probability of infection is fairly low (eg, 30%—see figure ). However, when the risk of treatment is very high (as when doing a pneumonectomy for possible lung cancer), clinicians want to be extremely sure of the diagnosis and might recommend treatment only when the probability of cancer is very high, perhaps > 95% (see ). Note that the treatment threshold does not necessarily correspond to the probability at which a disease might be considered confirmed or included. It is simply the point at which the risk of not treating is greater than the risk of treating.
Variation of Treatment Threshold (TT) with Risk of Treatment
Horizontal lines represent post-test probability. |

Quantitatively, the treatment threshold can be described as the point at which probability of disease (p) times benefit of treating a person with disease (B) equals probability of no disease (1 − p) times risk of treating a person without disease (R). Thus, at the treatment threshold
p × B = (1 − p) × R
Solving for p, this equation reduces to
p = R/(B +R)
From this equation, it is apparent that if B (benefit) and R (risk) are the same, the treatment threshold becomes 1/(1 + 1) = 0.5, which means that when the probability of disease is > 50%, clinicians would treat, and when probability is < 50%, clinicians would not treat.
For a clinical example, a patient with chest pain can be considered. How high should the clinical likelihood of acute myocardial infarction (MI) be before thrombolytic therapy should be given, assuming the only risk considered is short-term mortality? If it is postulated (for illustration) that mortality due to intracranial hemorrhage with thrombolytic therapy is 1%, then 1% is R, the fatality rate of mistakenly treating a patient who does not have an MI. If net mortality in patients with MI is decreased by 3% with thrombolytic therapy, then 3% is B. Then, treatment threshold is 1/(3 + 1), or 25%; thus, treatment should be given if the probability of acute MI is > 25%.
Alternatively, the treatment threshold equation can be rearranged to show that the treatment threshold is the point at which the odds of disease p/(1 −p) equal the risk:benefit ratio (R/B). The same numerical result is obtained as in the previously described example, with the treatment threshold occurring at the odds of the risk:benefit ratio (1/3); 1/3 odds corresponds to the previously obtained probability of 25% (see probability and odds).
Limitations of quantitative decision methods
Quantitative clinical decision making seems precise, but because many elements in the calculations (eg, pre-test probability) are often imprecisely known (if they are known at all), this methodology is difficult to use in all but the most well-defined and studied clinical situations. In addition, the patient's philosophy regarding medical care (ie, tolerance of risk and uncertainty) also needs to be taken into account in a shared decision-making process. For instance, although clinical guidelines do not recommend starting a lifelong course of urate-lowering medications after a first attack of gout, some patients prefer to begin such treatment immediately because they strongly want to avoid a second attack.