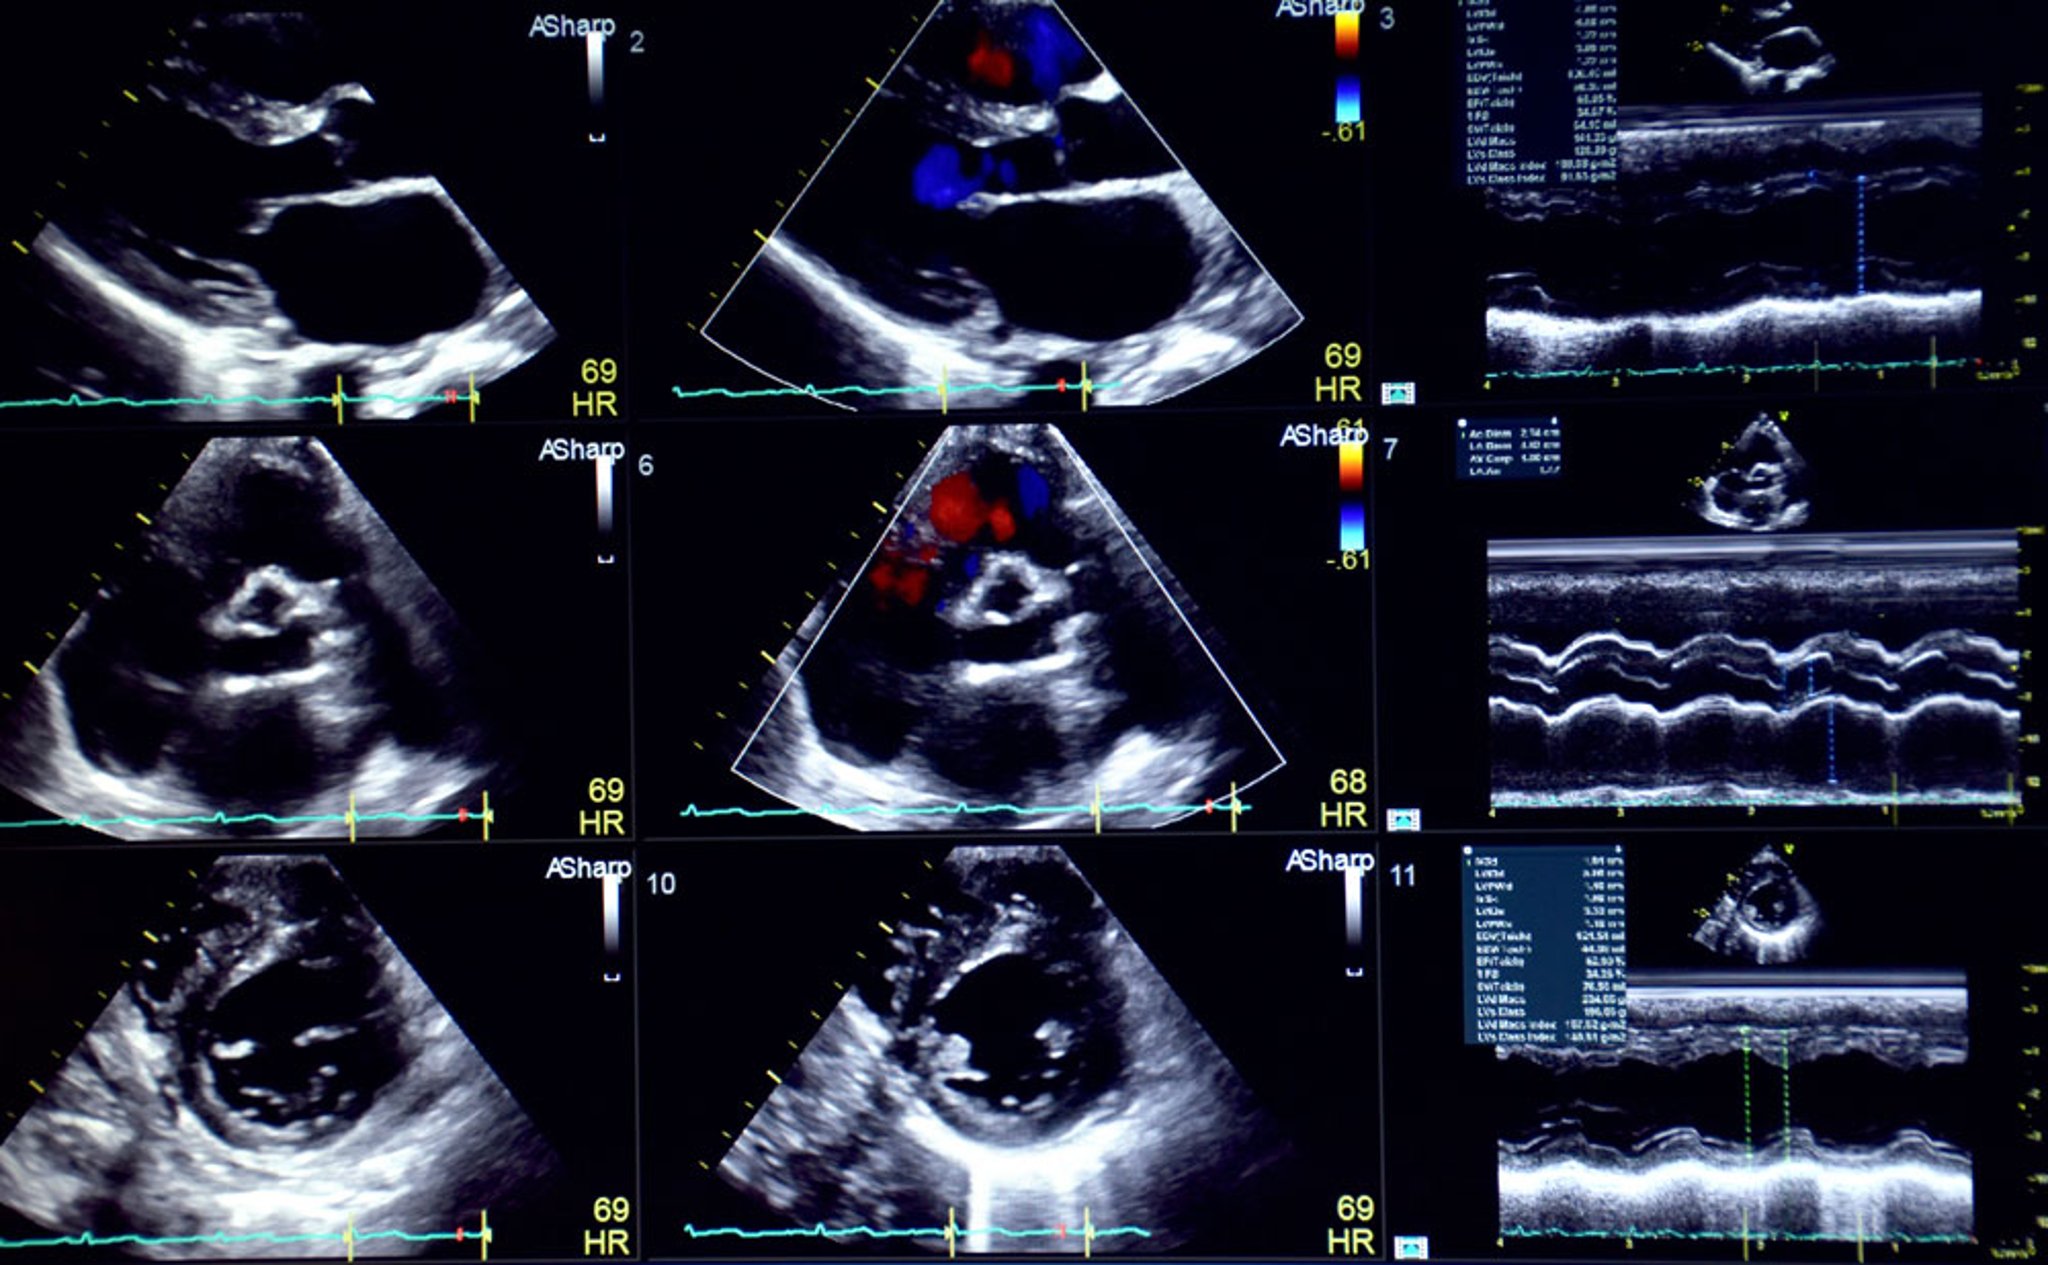
Echocardiogram (9-Panel Plot)
This 9-panel plot shows additional echocardiographic views and techniques, including a parasternal long axis view (upper left image), parasternal short axis views (middle left, lower left, lower middle images), color Doppler images (upper middle and central images), and M-mode (right upper, middle, and lower images).
Orrathai/stock.adobe.com
In these topics